
DataLink · Banking transaction intelligence
Turning banking transaction activity into clear operational insight.
How DataLink created a governed transaction dashboard that helps banking teams understand volumes, values, flow direction and emerging activity patterns.
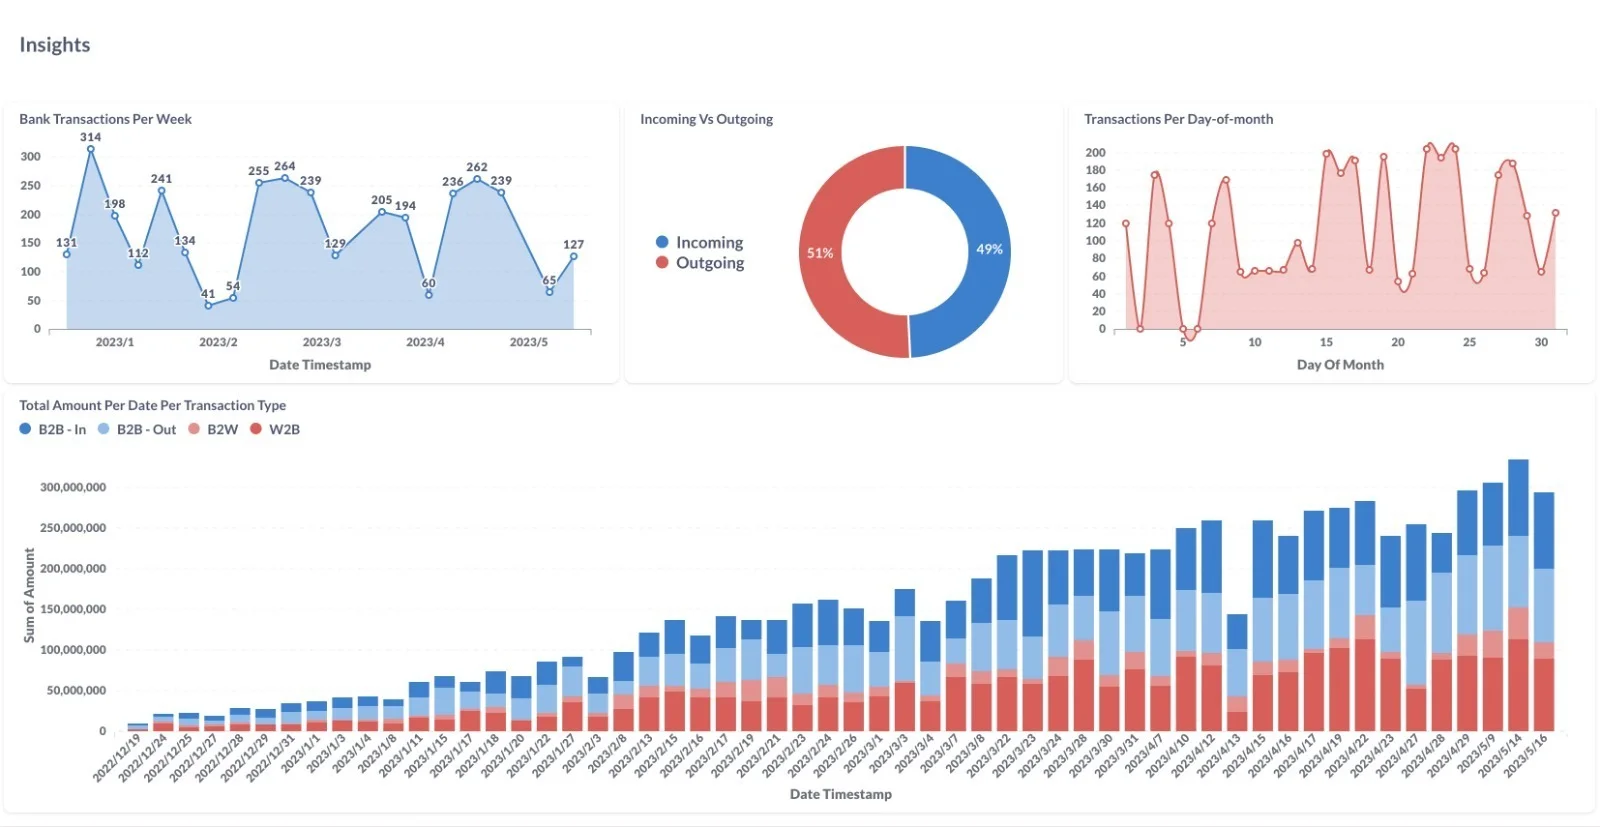
Banking teams needed a dependable way to interpret transaction activity across multiple reporting dimensions. Reviewing separate records and static reports made it difficult to see how volumes changed over time, compare incoming and outgoing activity, identify day-of-month patterns and understand the value contributed by different transaction categories.
What we built
DataLink consolidated authorised transaction data into the 360° Insights dashboard and applied consistent definitions, validation and reporting logic. The dashboard presents weekly transaction volumes, the balance between incoming and outgoing flows, daily activity patterns and transaction-value trends within one governed view. Interactive visualisation gives operational and management teams a faster way to explore performance while preserving a consistent source of information.
The difference
Technology people can depend on.
The result is a clearer, faster and more reliable way of working.